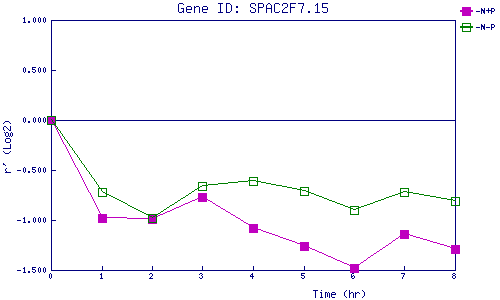
| 0 | 1 | 2 | 3 | 4 | 5 | 6 | 7 | 8 | |
| -N+P | 0.000 | -0.979 | -0.987 | -0.769 | -1.083 | -1.262 | -1.483 | -1.144 | -1.286 |
| -N-P | 0.000 | -0.724 | -0.982 | -0.664 | -0.614 | -0.707 | -0.897 | -0.717 | -0.811 |
|
-N+P: Nitrogen starved in the presence of P-factor -N-P: Nitrogen starved in the absence of P-factor |