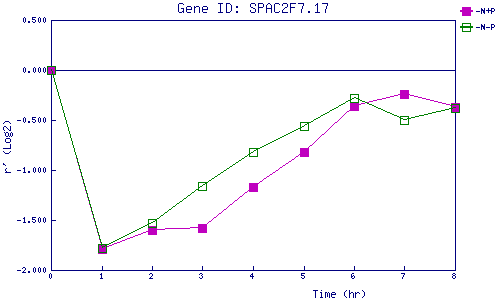
| 0 | 1 | 2 | 3 | 4 | 5 | 6 | 7 | 8 | |
| -N+P | 0.000 | -1.792 | -1.598 | -1.586 | -1.168 | -0.820 | -0.365 | -0.242 | -0.371 |
| -N-P | 0.000 | -1.782 | -1.529 | -1.160 | -0.820 | -0.556 | -0.282 | -0.497 | -0.382 |
|
-N+P: Nitrogen starved in the presence of P-factor -N-P: Nitrogen starved in the absence of P-factor |