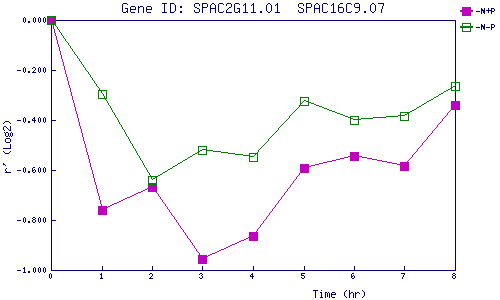
| 0 | 1 | 2 | 3 | 4 | 5 | 6 | 7 | 8 | |
| -N+P | 0.000 | -0.761 | -0.669 | -0.956 | -0.864 | -0.590 | -0.544 | -0.583 | -0.340 |
| -N-P | 0.000 | -0.296 | -0.640 | -0.519 | -0.547 | -0.324 | -0.402 | -0.384 | -0.266 |
|
-N+P: Nitrogen starved in the presence of P-factor -N-P: Nitrogen starved in the absence of P-factor |