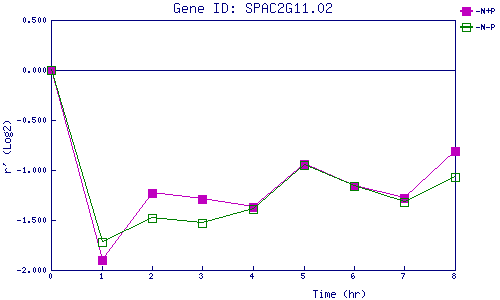
| 0 | 1 | 2 | 3 | 4 | 5 | 6 | 7 | 8 | |
| -N+P | 0.000 | -1.905 | -1.228 | -1.293 | -1.370 | -0.938 | -1.157 | -1.280 | -0.809 |
| -N-P | 0.000 | -1.719 | -1.485 | -1.531 | -1.389 | -0.950 | -1.163 | -1.320 | -1.070 |
|
-N+P: Nitrogen starved in the presence of P-factor -N-P: Nitrogen starved in the absence of P-factor |