prh1
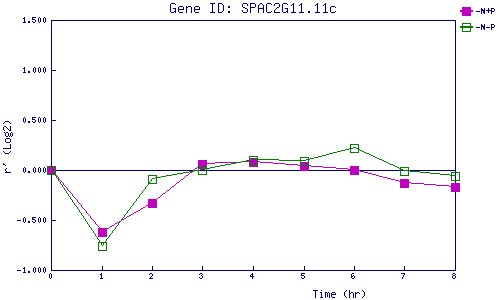
| 0 | 1 | 2 | 3 | 4 | 5 | 6 | 7 | 8 | |
| -N+P | 0.000 | -0.623 | -0.326 | 0.056 | 0.077 | 0.043 | -0.005 | -0.126 | -0.168 |
| -N-P | 0.000 | -0.755 | -0.087 | 0.003 | 0.095 | 0.086 | 0.221 | -0.010 | -0.060 |
|
-N+P: Nitrogen starved in the presence of P-factor -N-P: Nitrogen starved in the absence of P-factor |