hus2 rqh1 rad12
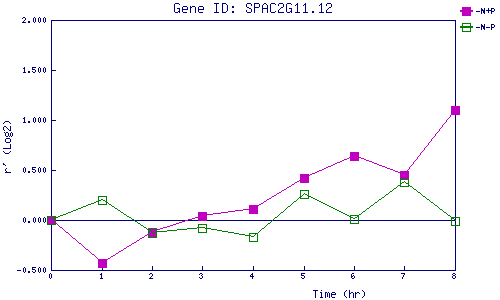
| 0 | 1 | 2 | 3 | 4 | 5 | 6 | 7 | 8 | |
| -N+P | 0.000 | -0.434 | -0.115 | 0.040 | 0.107 | 0.418 | 0.639 | 0.452 | 1.101 |
| -N-P | 0.000 | 0.199 | -0.131 | -0.078 | -0.168 | 0.256 | 0.012 | 0.381 | -0.006 |
|
-N+P: Nitrogen starved in the presence of P-factor -N-P: Nitrogen starved in the absence of P-factor |