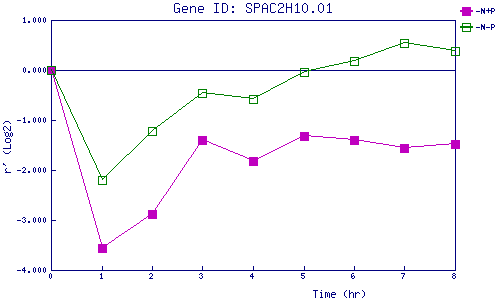
| 0 | 1 | 2 | 3 | 4 | 5 | 6 | 7 | 8 | |
| -N+P | 0.000 | -3.554 | -2.884 | -1.401 | -1.818 | -1.312 | -1.394 | -1.561 | -1.483 |
| -N-P | 0.000 | -2.191 | -1.229 | -0.457 | -0.585 | -0.048 | 0.177 | 0.531 | 0.371 |
|
-N+P: Nitrogen starved in the presence of P-factor -N-P: Nitrogen starved in the absence of P-factor |