| 0 | 1 | 2 | 3 | 4 | 5 | 6 | 7 | 8 | |
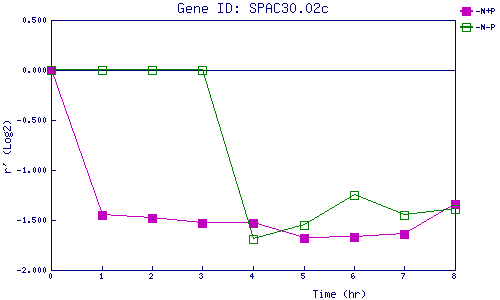
| -N+P | 0.000 | -1.448 | -1.475 | -1.531 | -1.527 | -1.679 | -1.666 | -1.637 | -1.340 |
| -N-P | 0.000 | 0.000 | 0.000 | 0.000 | -1.686 | -1.550 | -1.250 | -1.448 | -1.387 |
|
-N+P: Nitrogen starved in the presence of P-factor -N-P: Nitrogen starved in the absence of P-factor |