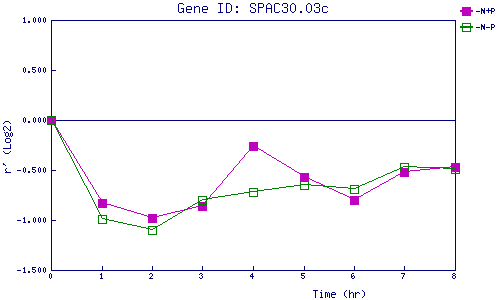
| 0 | 1 | 2 | 3 | 4 | 5 | 6 | 7 | 8 | |
| -N+P | 0.000 | -0.833 | -0.985 | -0.857 | -0.263 | -0.569 | -0.799 | -0.518 | -0.473 |
| -N-P | 0.000 | -0.992 | -1.100 | -0.799 | -0.721 | -0.654 | -0.686 | -0.472 | -0.488 |
|
-N+P: Nitrogen starved in the presence of P-factor -N-P: Nitrogen starved in the absence of P-factor |