prp3
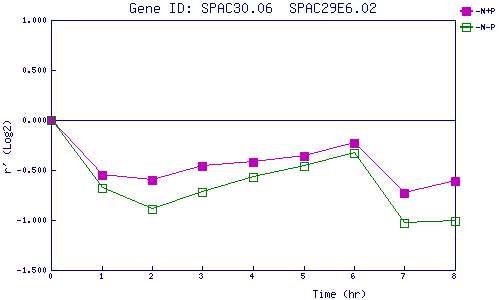
| 0 | 1 | 2 | 3 | 4 | 5 | 6 | 7 | 8 | |
| -N+P | 0.000 | -0.553 | -0.604 | -0.465 | -0.422 | -0.364 | -0.229 | -0.732 | -0.607 |
| -N-P | 0.000 | -0.685 | -0.893 | -0.720 | -0.566 | -0.460 | -0.326 | -1.027 | -1.007 |
|
-N+P: Nitrogen starved in the presence of P-factor -N-P: Nitrogen starved in the absence of P-factor |