| 0 | 1 | 2 | 3 | 4 | 5 | 6 | 7 | 8 | |
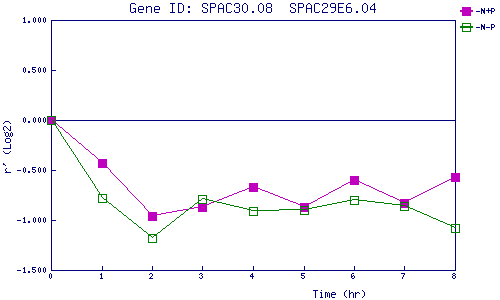
| -N+P | 0.000 | -0.429 | -0.965 | -0.870 | -0.670 | -0.874 | -0.598 | -0.834 | -0.568 |
| -N-P | 0.000 | -0.778 | -1.175 | -0.792 | -0.907 | -0.896 | -0.801 | -0.855 | -1.081 |
|
-N+P: Nitrogen starved in the presence of P-factor -N-P: Nitrogen starved in the absence of P-factor |