| 0 | 1 | 2 | 3 | 4 | 5 | 6 | 7 | 8 | |
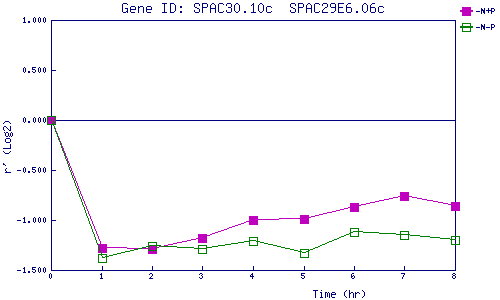
| -N+P | 0.000 | -1.285 | -1.289 | -1.176 | -0.996 | -0.992 | -0.873 | -0.755 | -0.855 |
| -N-P | 0.000 | -1.376 | -1.262 | -1.286 | -1.209 | -1.327 | -1.124 | -1.150 | -1.199 |
|
-N+P: Nitrogen starved in the presence of P-factor -N-P: Nitrogen starved in the absence of P-factor |