| 0 | 1 | 2 | 3 | 4 | 5 | 6 | 7 | 8 | |
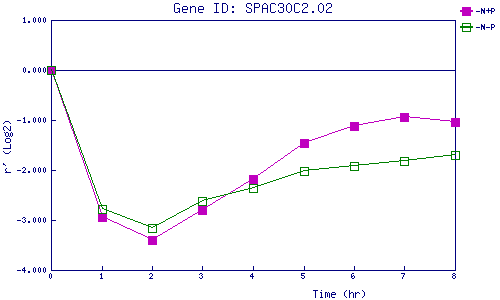
| -N+P | 0.000 | -2.943 | -3.398 | -2.790 | -2.179 | -1.454 | -1.117 | -0.947 | -1.043 |
| -N-P | 0.000 | -2.774 | -3.166 | -2.627 | -2.352 | -2.025 | -1.915 | -1.818 | -1.692 |
|
-N+P: Nitrogen starved in the presence of P-factor -N-P: Nitrogen starved in the absence of P-factor |