| 0 | 1 | 2 | 3 | 4 | 5 | 6 | 7 | 8 | |
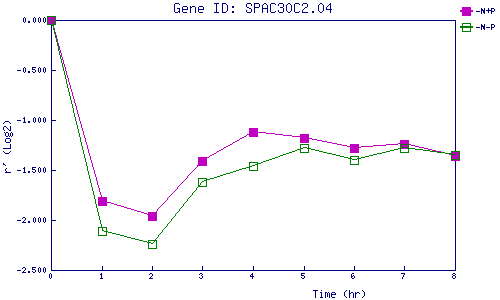
| -N+P | 0.000 | -1.808 | -1.964 | -1.409 | -1.123 | -1.182 | -1.275 | -1.239 | -1.358 |
| -N-P | 0.000 | -2.111 | -2.244 | -1.617 | -1.457 | -1.283 | -1.402 | -1.282 | -1.350 |
|
-N+P: Nitrogen starved in the presence of P-factor -N-P: Nitrogen starved in the absence of P-factor |