erv14
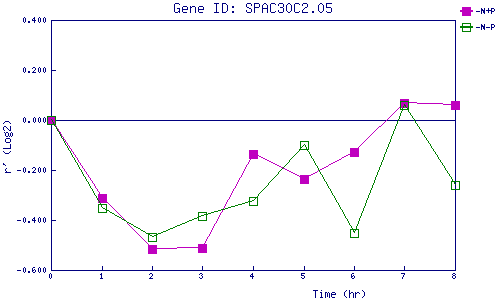
| 0 | 1 | 2 | 3 | 4 | 5 | 6 | 7 | 8 | |
| -N+P | 0.000 | -0.311 | -0.517 | -0.512 | -0.135 | -0.236 | -0.129 | 0.067 | 0.059 |
| -N-P | 0.000 | -0.354 | -0.468 | -0.382 | -0.323 | -0.100 | -0.452 | 0.059 | -0.261 |
|
-N+P: Nitrogen starved in the presence of P-factor -N-P: Nitrogen starved in the absence of P-factor |