| 0 | 1 | 2 | 3 | 4 | 5 | 6 | 7 | 8 | |
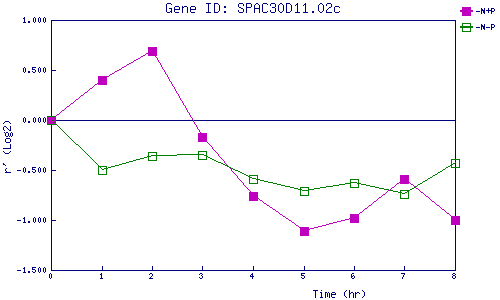
| -N+P | 0.000 | 0.398 | 0.691 | -0.168 | -0.757 | -1.106 | -0.983 | -0.590 | -1.004 |
| -N-P | 0.000 | -0.505 | -0.356 | -0.351 | -0.586 | -0.706 | -0.634 | -0.736 | -0.427 |
|
-N+P: Nitrogen starved in the presence of P-factor -N-P: Nitrogen starved in the absence of P-factor |