aps3
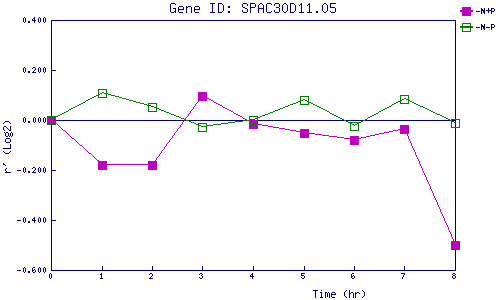
| 0 | 1 | 2 | 3 | 4 | 5 | 6 | 7 | 8 | |
| -N+P | 0.000 | -0.180 | -0.179 | 0.096 | -0.014 | -0.053 | -0.081 | -0.036 | -0.501 |
| -N-P | 0.000 | 0.109 | 0.053 | -0.029 | -0.001 | 0.081 | -0.024 | 0.085 | -0.011 |
|
-N+P: Nitrogen starved in the presence of P-factor -N-P: Nitrogen starved in the absence of P-factor |