nth1
| 0 | 1 | 2 | 3 | 4 | 5 | 6 | 7 | 8 | |
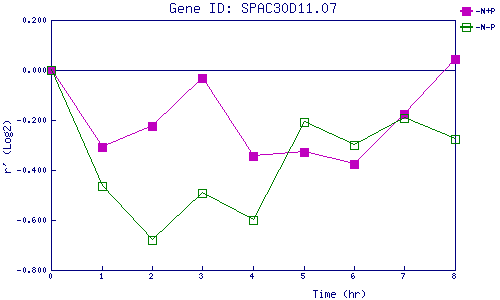
| -N+P | 0.000 | -0.307 | -0.225 | -0.032 | -0.346 | -0.326 | -0.375 | -0.178 | 0.045 |
| -N-P | 0.000 | -0.465 | -0.678 | -0.491 | -0.598 | -0.207 | -0.299 | -0.194 | -0.276 |
|
-N+P: Nitrogen starved in the presence of P-factor -N-P: Nitrogen starved in the absence of P-factor |