cwf19
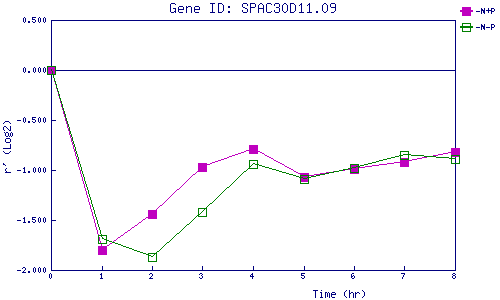
| 0 | 1 | 2 | 3 | 4 | 5 | 6 | 7 | 8 | |
| -N+P | 0.000 | -1.800 | -1.435 | -0.966 | -0.786 | -1.066 | -0.992 | -0.919 | -0.819 |
| -N-P | 0.000 | -1.689 | -1.871 | -1.418 | -0.938 | -1.087 | -0.979 | -0.850 | -0.894 |
|
-N+P: Nitrogen starved in the presence of P-factor -N-P: Nitrogen starved in the absence of P-factor |