rad22
| 0 | 1 | 2 | 3 | 4 | 5 | 6 | 7 | 8 | |
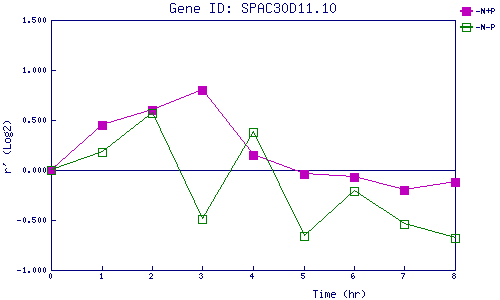
| -N+P | 0.000 | 0.451 | 0.602 | 0.799 | 0.149 | -0.042 | -0.072 | -0.200 | -0.118 |
| -N-P | 0.000 | 0.181 | 0.569 | -0.492 | 0.377 | -0.658 | -0.214 | -0.545 | -0.677 |
|
-N+P: Nitrogen starved in the presence of P-factor -N-P: Nitrogen starved in the absence of P-factor |
