rpl38-2 rpl3802 rps38
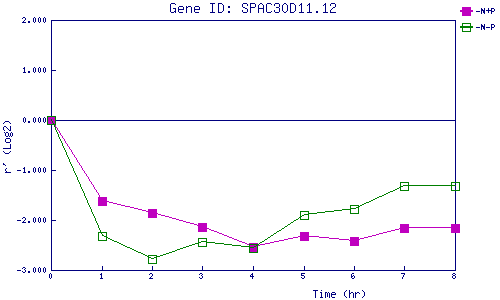
| 0 | 1 | 2 | 3 | 4 | 5 | 6 | 7 | 8 | |
| -N+P | 0.000 | -1.612 | -1.859 | -2.143 | -2.531 | -2.311 | -2.413 | -2.159 | -2.169 |
| -N-P | 0.000 | -2.330 | -2.772 | -2.435 | -2.565 | -1.901 | -1.773 | -1.328 | -1.323 |
|
-N+P: Nitrogen starved in the presence of P-factor -N-P: Nitrogen starved in the absence of P-factor |