hus5 ubc9
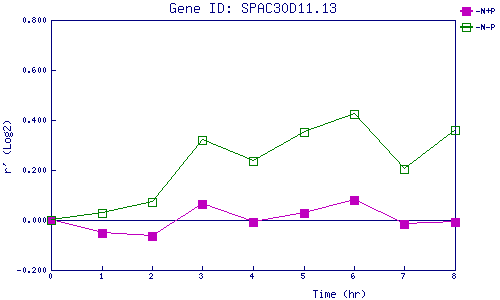
| 0 | 1 | 2 | 3 | 4 | 5 | 6 | 7 | 8 | |
| -N+P | 0.000 | -0.053 | -0.062 | 0.066 | -0.010 | 0.029 | 0.081 | -0.018 | -0.007 |
| -N-P | 0.000 | 0.028 | 0.072 | 0.322 | 0.235 | 0.354 | 0.426 | 0.205 | 0.358 |
|
-N+P: Nitrogen starved in the presence of P-factor -N-P: Nitrogen starved in the absence of P-factor |