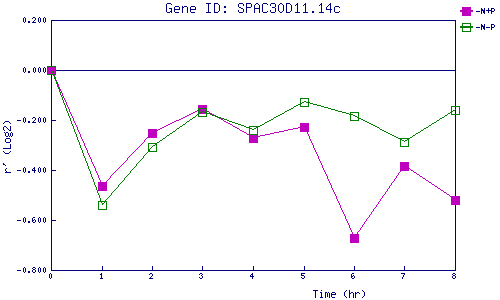
| 0 | 1 | 2 | 3 | 4 | 5 | 6 | 7 | 8 | |
| -N+P | 0.000 | -0.465 | -0.251 | -0.157 | -0.271 | -0.229 | -0.674 | -0.384 | -0.519 |
| -N-P | 0.000 | -0.540 | -0.308 | -0.169 | -0.241 | -0.127 | -0.182 | -0.290 | -0.161 |
|
-N+P: Nitrogen starved in the presence of P-factor -N-P: Nitrogen starved in the absence of P-factor |