| 0 | 1 | 2 | 3 | 4 | 5 | 6 | 7 | 8 | |
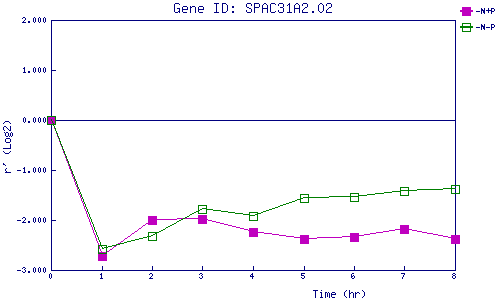
| -N+P | 0.000 | -2.715 | -2.005 | -1.987 | -2.240 | -2.373 | -2.335 | -2.180 | -2.373 |
| -N-P | 0.000 | -2.582 | -2.320 | -1.778 | -1.928 | -1.550 | -1.535 | -1.411 | -1.385 |
|
-N+P: Nitrogen starved in the presence of P-factor -N-P: Nitrogen starved in the absence of P-factor |