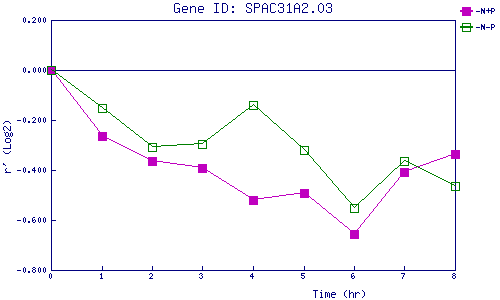
| 0 | 1 | 2 | 3 | 4 | 5 | 6 | 7 | 8 | |
| -N+P | 0.000 | -0.264 | -0.364 | -0.394 | -0.519 | -0.492 | -0.658 | -0.409 | -0.334 |
| -N-P | 0.000 | -0.152 | -0.308 | -0.294 | -0.140 | -0.321 | -0.550 | -0.365 | -0.462 |
|
-N+P: Nitrogen starved in the presence of P-factor -N-P: Nitrogen starved in the absence of P-factor |