mis4
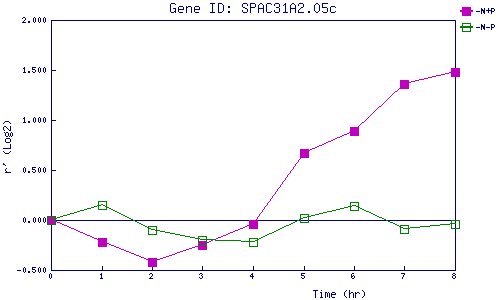
| 0 | 1 | 2 | 3 | 4 | 5 | 6 | 7 | 8 | |
| -N+P | 0.000 | -0.220 | -0.423 | -0.252 | -0.042 | 0.671 | 0.894 | 1.361 | 1.479 |
| -N-P | 0.000 | 0.152 | -0.098 | -0.202 | -0.225 | 0.019 | 0.139 | -0.091 | -0.043 |
|
-N+P: Nitrogen starved in the presence of P-factor -N-P: Nitrogen starved in the absence of P-factor |
