| 0 | 1 | 2 | 3 | 4 | 5 | 6 | 7 | 8 | |
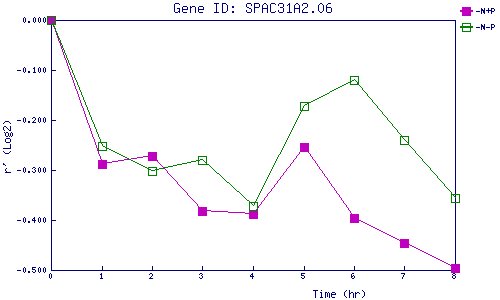
| -N+P | 0.000 | -0.288 | -0.271 | -0.382 | -0.387 | -0.254 | -0.396 | -0.446 | -0.497 |
| -N-P | 0.000 | -0.251 | -0.302 | -0.281 | -0.373 | -0.172 | -0.119 | -0.240 | -0.355 |
|
-N+P: Nitrogen starved in the presence of P-factor -N-P: Nitrogen starved in the absence of P-factor |