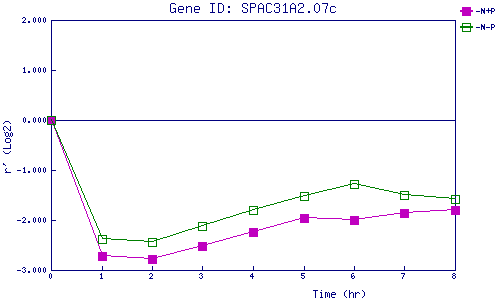
| 0 | 1 | 2 | 3 | 4 | 5 | 6 | 7 | 8 | |
| -N+P | 0.000 | -2.727 | -2.776 | -2.525 | -2.249 | -1.969 | -1.994 | -1.859 | -1.807 |
| -N-P | 0.000 | -2.377 | -2.444 | -2.116 | -1.795 | -1.528 | -1.281 | -1.498 | -1.590 |
|
-N+P: Nitrogen starved in the presence of P-factor -N-P: Nitrogen starved in the absence of P-factor |