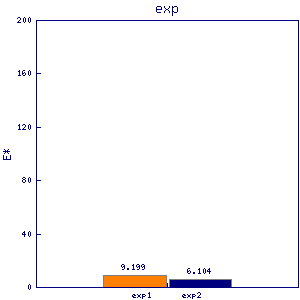
apm4
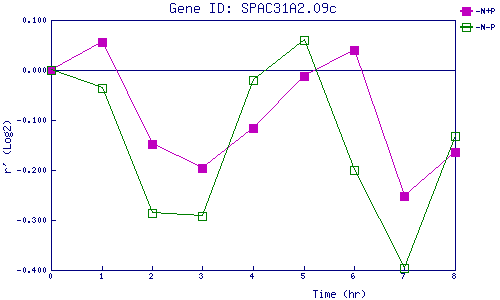
| 0 | 1 | 2 | 3 | 4 | 5 | 6 | 7 | 8 | |
| -N+P | 0.000 | 0.057 | -0.149 | -0.197 | -0.117 | -0.012 | 0.041 | -0.252 | -0.163 |
| -N-P | 0.000 | -0.037 | -0.286 | -0.292 | -0.019 | 0.059 | -0.200 | -0.397 | -0.131 |
|
-N+P: Nitrogen starved in the presence of P-factor -N-P: Nitrogen starved in the absence of P-factor |