sft1
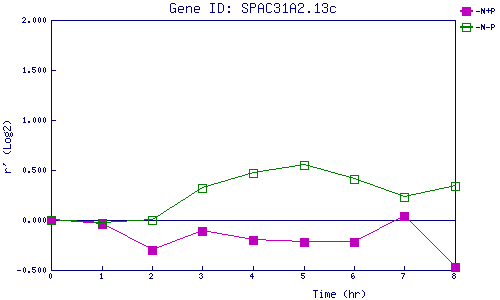
| 0 | 1 | 2 | 3 | 4 | 5 | 6 | 7 | 8 | |
| -N+P | 0.000 | -0.045 | -0.300 | -0.109 | -0.197 | -0.218 | -0.223 | 0.036 | -0.470 |
| -N-P | 0.000 | -0.029 | 0.000 | 0.320 | 0.473 | 0.551 | 0.408 | 0.227 | 0.338 |
|
-N+P: Nitrogen starved in the presence of P-factor -N-P: Nitrogen starved in the absence of P-factor |