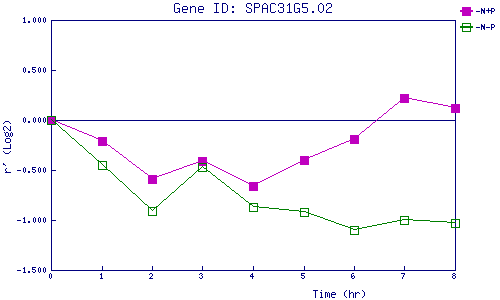
| 0 | 1 | 2 | 3 | 4 | 5 | 6 | 7 | 8 | |
| -N+P | 0.000 | -0.214 | -0.591 | -0.408 | -0.657 | -0.402 | -0.194 | 0.222 | 0.116 |
| -N-P | 0.000 | -0.447 | -0.910 | -0.469 | -0.873 | -0.920 | -1.097 | -1.002 | -1.033 |
|
-N+P: Nitrogen starved in the presence of P-factor -N-P: Nitrogen starved in the absence of P-factor |