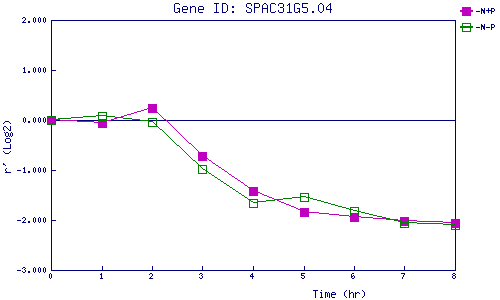
| 0 | 1 | 2 | 3 | 4 | 5 | 6 | 7 | 8 | |
| -N+P | 0.000 | -0.056 | 0.230 | -0.712 | -1.423 | -1.846 | -1.933 | -2.025 | -2.060 |
| -N-P | 0.000 | 0.087 | -0.033 | -0.978 | -1.654 | -1.538 | -1.823 | -2.051 | -2.099 |
|
-N+P: Nitrogen starved in the presence of P-factor -N-P: Nitrogen starved in the absence of P-factor |