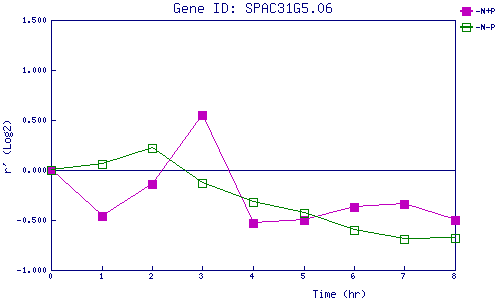
| 0 | 1 | 2 | 3 | 4 | 5 | 6 | 7 | 8 | |
| -N+P | 0.000 | -0.465 | -0.138 | 0.553 | -0.534 | -0.499 | -0.369 | -0.336 | -0.502 |
| -N-P | 0.000 | 0.063 | 0.218 | -0.133 | -0.325 | -0.434 | -0.595 | -0.693 | -0.685 |
|
-N+P: Nitrogen starved in the presence of P-factor -N-P: Nitrogen starved in the absence of P-factor |