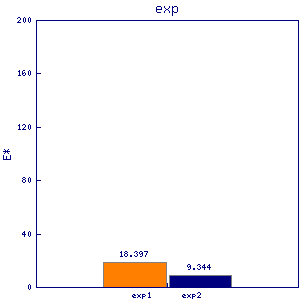
ups ups1
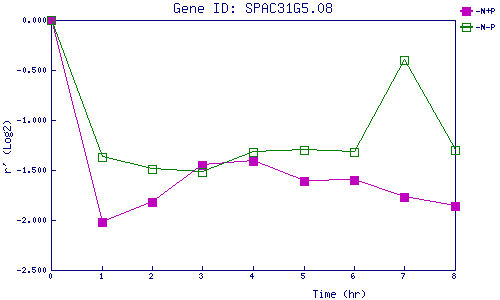
| 0 | 1 | 2 | 3 | 4 | 5 | 6 | 7 | 8 | |
| -N+P | 0.000 | -2.026 | -1.821 | -1.451 | -1.408 | -1.607 | -1.596 | -1.767 | -1.864 |
| -N-P | 0.000 | -1.367 | -1.490 | -1.515 | -1.325 | -1.301 | -1.323 | -0.402 | -1.301 |
|
-N+P: Nitrogen starved in the presence of P-factor -N-P: Nitrogen starved in the absence of P-factor |