pad1 sks1 bfr2 rpn11
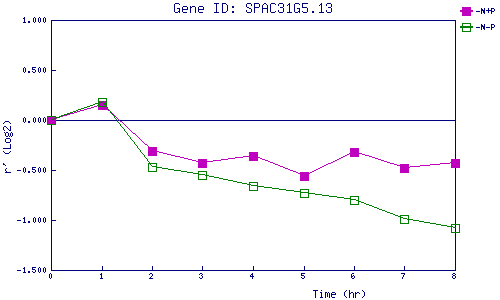
| 0 | 1 | 2 | 3 | 4 | 5 | 6 | 7 | 8 | |
| -N+P | 0.000 | 0.152 | -0.312 | -0.426 | -0.362 | -0.562 | -0.325 | -0.477 | -0.434 |
| -N-P | 0.000 | 0.181 | -0.474 | -0.548 | -0.662 | -0.731 | -0.798 | -0.989 | -1.078 |
|
-N+P: Nitrogen starved in the presence of P-factor -N-P: Nitrogen starved in the absence of P-factor |