rps1001 rps10-1
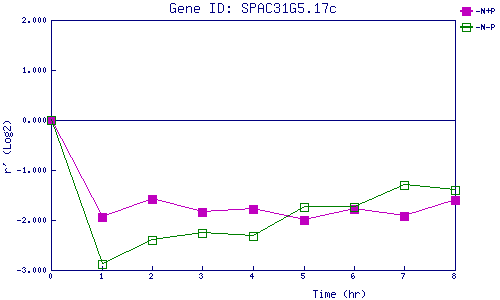
| 0 | 1 | 2 | 3 | 4 | 5 | 6 | 7 | 8 | |
| -N+P | 0.000 | -1.949 | -1.574 | -1.846 | -1.775 | -1.993 | -1.780 | -1.915 | -1.603 |
| -N-P | 0.000 | -2.879 | -2.390 | -2.255 | -2.321 | -1.732 | -1.738 | -1.304 | -1.392 |
|
-N+P: Nitrogen starved in the presence of P-factor -N-P: Nitrogen starved in the absence of P-factor |