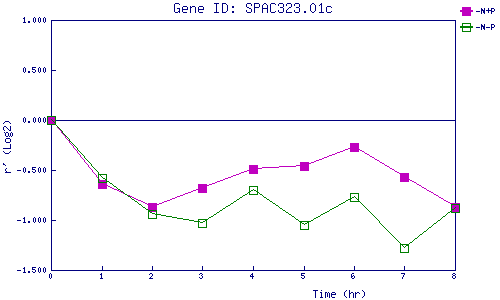
| 0 | 1 | 2 | 3 | 4 | 5 | 6 | 7 | 8 | |
| -N+P | 0.000 | -0.637 | -0.870 | -0.679 | -0.490 | -0.464 | -0.271 | -0.573 | -0.871 |
| -N-P | 0.000 | -0.581 | -0.942 | -1.026 | -0.699 | -1.051 | -0.772 | -1.279 | -0.877 |
|
-N+P: Nitrogen starved in the presence of P-factor -N-P: Nitrogen starved in the absence of P-factor |
