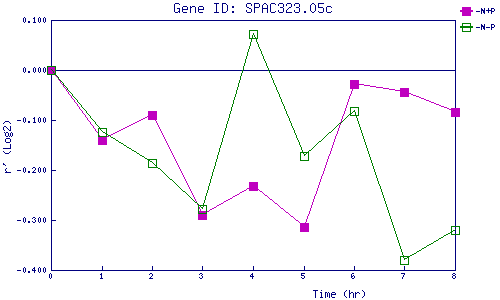
| 0 | 1 | 2 | 3 | 4 | 5 | 6 | 7 | 8 | |
| -N+P | 0.000 | -0.141 | -0.090 | -0.290 | -0.232 | -0.314 | -0.028 | -0.045 | -0.083 |
| -N-P | 0.000 | -0.125 | -0.186 | -0.278 | 0.072 | -0.171 | -0.082 | -0.379 | -0.321 |
|
-N+P: Nitrogen starved in the presence of P-factor -N-P: Nitrogen starved in the absence of P-factor |