| 0 | 1 | 2 | 3 | 4 | 5 | 6 | 7 | 8 | |
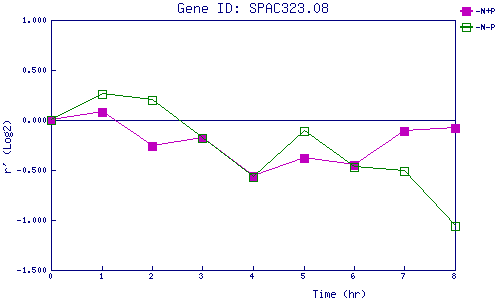
| -N+P | 0.000 | 0.084 | -0.259 | -0.180 | -0.560 | -0.379 | -0.453 | -0.110 | -0.082 |
| -N-P | 0.000 | 0.259 | 0.198 | -0.178 | -0.573 | -0.113 | -0.468 | -0.507 | -1.061 |
|
-N+P: Nitrogen starved in the presence of P-factor -N-P: Nitrogen starved in the absence of P-factor |