reserved_name_ubp2
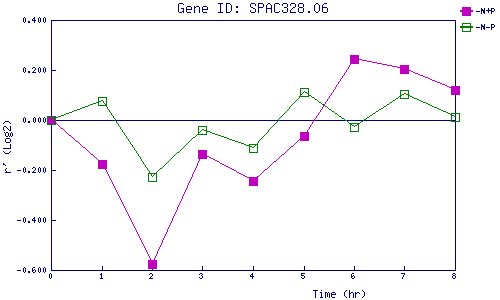
| 0 | 1 | 2 | 3 | 4 | 5 | 6 | 7 | 8 | |
| -N+P | 0.000 | -0.177 | -0.575 | -0.138 | -0.244 | -0.065 | 0.243 | 0.203 | 0.120 |
| -N-P | 0.000 | 0.076 | -0.227 | -0.040 | -0.111 | 0.114 | -0.028 | 0.106 | 0.013 |
|
-N+P: Nitrogen starved in the presence of P-factor -N-P: Nitrogen starved in the absence of P-factor |