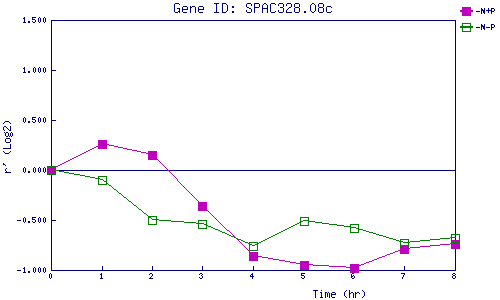
| 0 | 1 | 2 | 3 | 4 | 5 | 6 | 7 | 8 | |
| -N+P | 0.000 | 0.257 | 0.154 | -0.365 | -0.864 | -0.954 | -0.979 | -0.794 | -0.738 |
| -N-P | 0.000 | -0.097 | -0.497 | -0.535 | -0.759 | -0.509 | -0.584 | -0.734 | -0.675 |
|
-N+P: Nitrogen starved in the presence of P-factor -N-P: Nitrogen starved in the absence of P-factor |