rps5-2 rps502
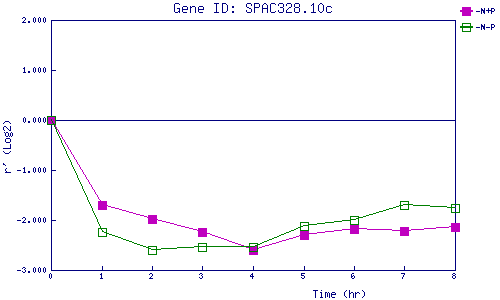
| 0 | 1 | 2 | 3 | 4 | 5 | 6 | 7 | 8 | |
| -N+P | 0.000 | -1.692 | -1.973 | -2.236 | -2.592 | -2.298 | -2.187 | -2.222 | -2.131 |
| -N-P | 0.000 | -2.235 | -2.605 | -2.541 | -2.544 | -2.114 | -2.004 | -1.709 | -1.758 |
|
-N+P: Nitrogen starved in the presence of P-factor -N-P: Nitrogen starved in the absence of P-factor |