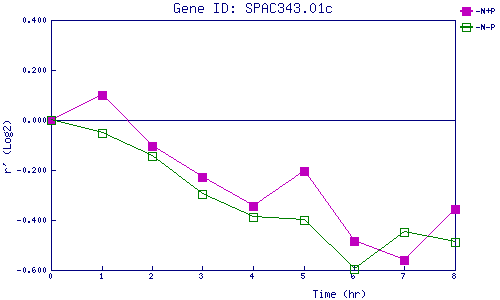
| 0 | 1 | 2 | 3 | 4 | 5 | 6 | 7 | 8 | |
| -N+P | 0.000 | 0.099 | -0.102 | -0.229 | -0.344 | -0.204 | -0.485 | -0.560 | -0.357 |
| -N-P | 0.000 | -0.052 | -0.146 | -0.294 | -0.389 | -0.398 | -0.595 | -0.448 | -0.487 |
|
-N+P: Nitrogen starved in the presence of P-factor -N-P: Nitrogen starved in the absence of P-factor |