| 0 | 1 | 2 | 3 | 4 | 5 | 6 | 7 | 8 | |
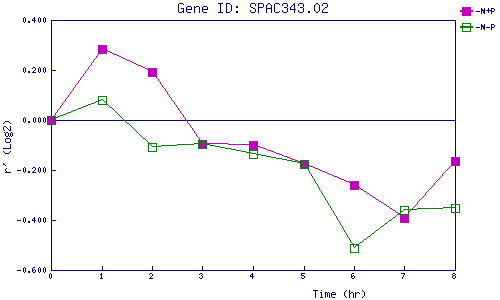
| -N+P | 0.000 | 0.285 | 0.193 | -0.098 | -0.100 | -0.178 | -0.260 | -0.394 | -0.165 |
| -N-P | 0.000 | 0.081 | -0.109 | -0.094 | -0.134 | -0.178 | -0.510 | -0.360 | -0.351 |
|
-N+P: Nitrogen starved in the presence of P-factor -N-P: Nitrogen starved in the absence of P-factor |