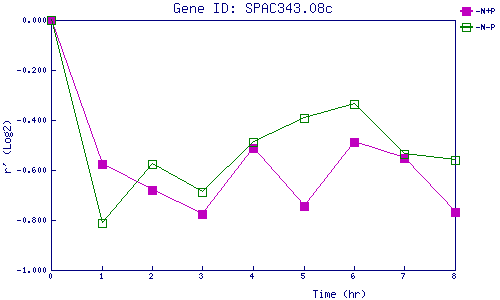
| 0 | 1 | 2 | 3 | 4 | 5 | 6 | 7 | 8 | |
| -N+P | 0.000 | -0.577 | -0.680 | -0.775 | -0.511 | -0.744 | -0.488 | -0.551 | -0.766 |
| -N-P | 0.000 | -0.811 | -0.574 | -0.690 | -0.490 | -0.391 | -0.338 | -0.535 | -0.558 |
|
-N+P: Nitrogen starved in the presence of P-factor -N-P: Nitrogen starved in the absence of P-factor |