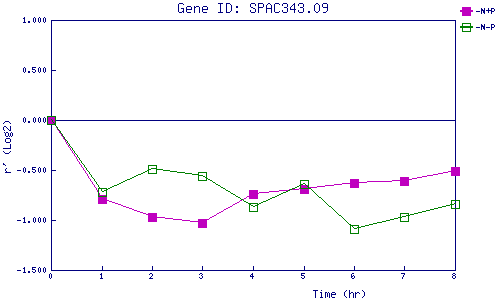
| 0 | 1 | 2 | 3 | 4 | 5 | 6 | 7 | 8 | |
| -N+P | 0.000 | -0.794 | -0.969 | -1.034 | -0.735 | -0.689 | -0.629 | -0.606 | -0.510 |
| -N-P | 0.000 | -0.715 | -0.487 | -0.555 | -0.870 | -0.643 | -1.088 | -0.971 | -0.838 |
|
-N+P: Nitrogen starved in the presence of P-factor -N-P: Nitrogen starved in the absence of P-factor |