mthfr2 met11
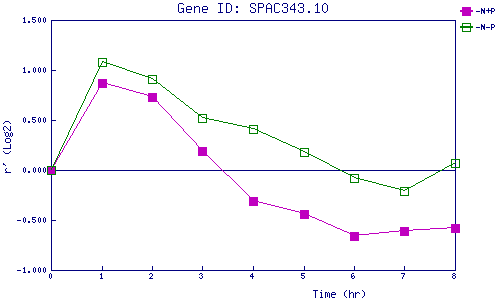
| 0 | 1 | 2 | 3 | 4 | 5 | 6 | 7 | 8 | |
| -N+P | 0.000 | 0.871 | 0.728 | 0.193 | -0.312 | -0.443 | -0.665 | -0.611 | -0.578 |
| -N-P | 0.000 | 1.084 | 0.914 | 0.516 | 0.414 | 0.177 | -0.085 | -0.213 | 0.069 |
|
-N+P: Nitrogen starved in the presence of P-factor -N-P: Nitrogen starved in the absence of P-factor |