| 0 | 1 | 2 | 3 | 4 | 5 | 6 | 7 | 8 | |
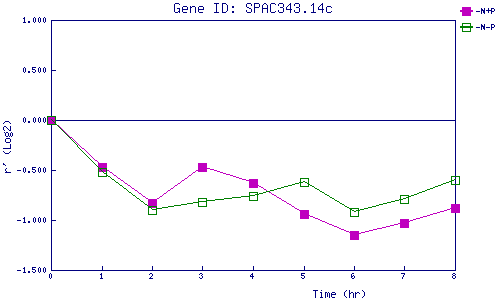
| -N+P | 0.000 | -0.470 | -0.828 | -0.466 | -0.626 | -0.935 | -1.154 | -1.027 | -0.880 |
| -N-P | 0.000 | -0.525 | -0.898 | -0.821 | -0.758 | -0.621 | -0.925 | -0.787 | -0.599 |
|
-N+P: Nitrogen starved in the presence of P-factor -N-P: Nitrogen starved in the absence of P-factor |