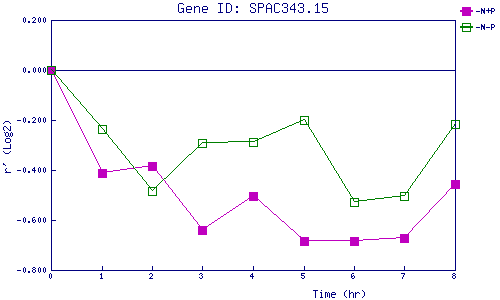
| 0 | 1 | 2 | 3 | 4 | 5 | 6 | 7 | 8 | |
| -N+P | 0.000 | -0.413 | -0.383 | -0.642 | -0.503 | -0.685 | -0.684 | -0.674 | -0.456 |
| -N-P | 0.000 | -0.237 | -0.485 | -0.293 | -0.288 | -0.198 | -0.530 | -0.504 | -0.215 |
|
-N+P: Nitrogen starved in the presence of P-factor -N-P: Nitrogen starved in the absence of P-factor |