lys2
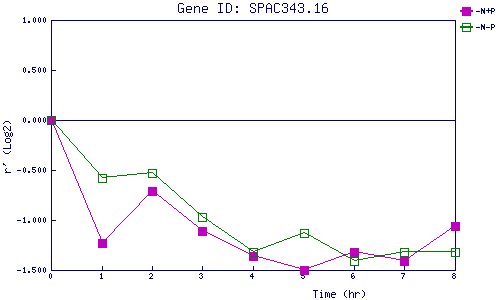
| 0 | 1 | 2 | 3 | 4 | 5 | 6 | 7 | 8 | |
| -N+P | 0.000 | -1.229 | -0.712 | -1.113 | -1.357 | -1.500 | -1.323 | -1.411 | -1.065 |
| -N-P | 0.000 | -0.579 | -0.526 | -0.966 | -1.318 | -1.128 | -1.407 | -1.319 | -1.317 |
|
-N+P: Nitrogen starved in the presence of P-factor -N-P: Nitrogen starved in the absence of P-factor |